
00 Individuals
Individuals thrive when their health outcomes improve and when chronic disease and exposure to violence decreases.
+1.8% change in adults with health concerns
+1.3% White
+2.9% People of Color
(as of 2023)
+1.8% change in adults with health concerns +1.3% White +2.9% People of Color (as of 2023)

What are we seeing?
Among the indicators for individuals, four changes in the data raise concerns for civic wellness considerations, as follows:
Decline in group participation rates
Decreased number of unhealthy air quality days
Increased incarceration rates for people of color
Increase in health concerns
-
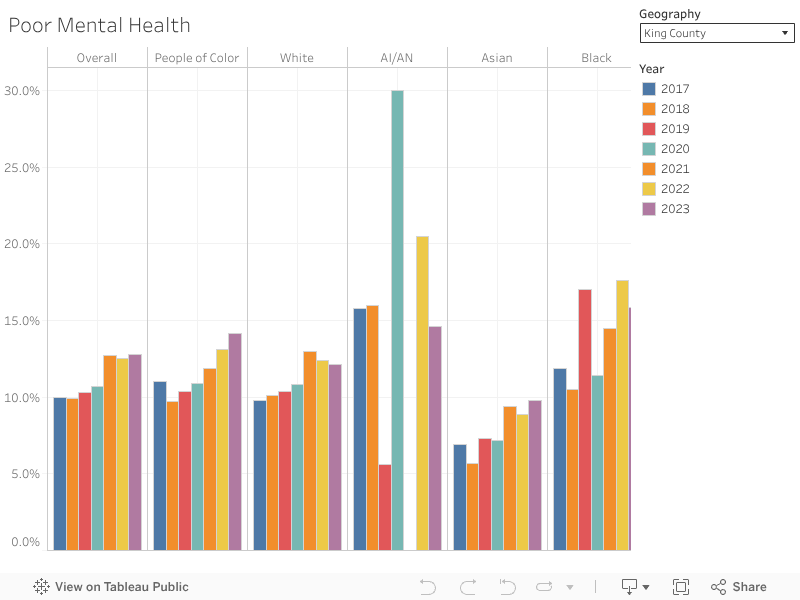
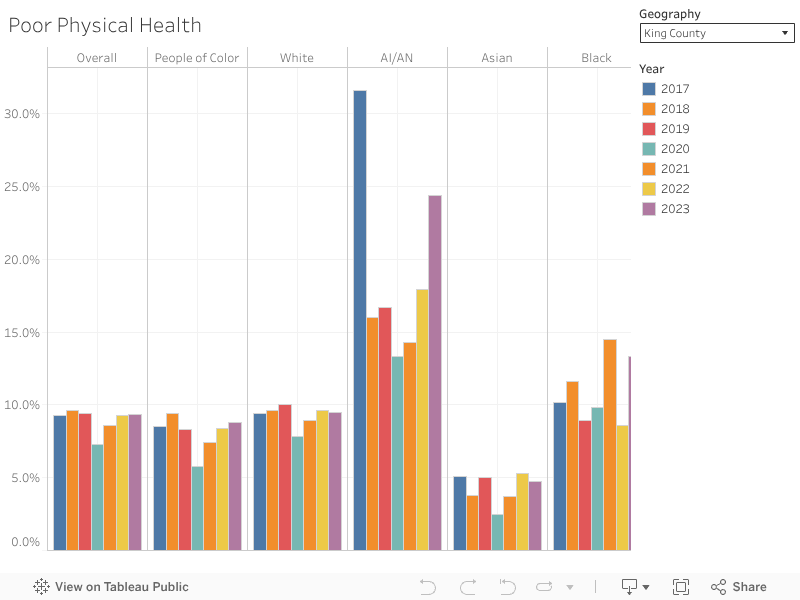
Poor physical health concerns increased overall, but this indicator decreased for people who are Black, American Indian or Alaskan Native (AI/AN), and Native Hawaiian or Pacific Islander (NHPI). Reports of poor mental health also minimally decreased overall, however reporting of poor mental health decreased amongst people who are American Indian or Alaskan Native and Hispanic.
Health concerns increased for all racial categories, except for people who are Black and American Indian or Alaskan Native.
Incarceration rates decreased overall in 2023, with rates for Black and American Indian or Asian people rising — 4.7 times and 1.1 times higher, respectively, than the rates for White people.
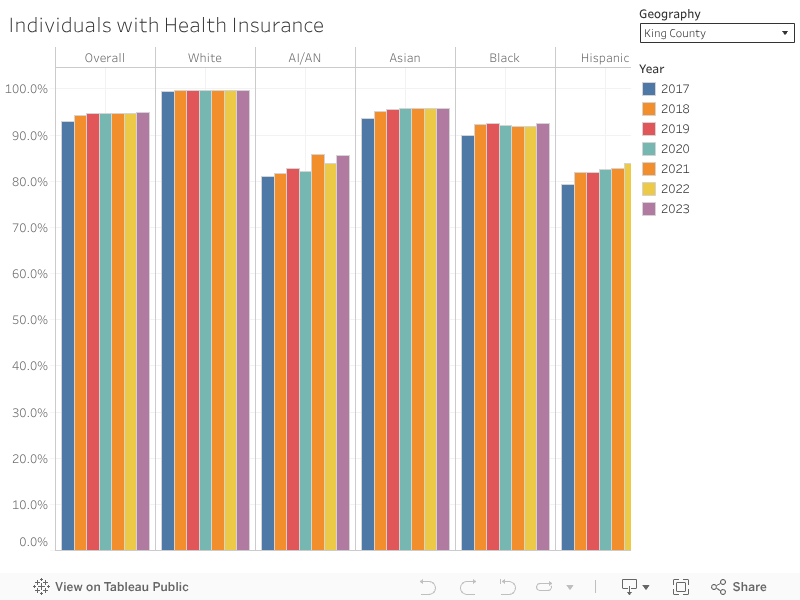
Individuals with health insurance slightly rose from 2022 to 2023 but declined slightly for American Indian or Alaskan Native (AI/AN) and Native Hawaiian or Pacific Islander (NHPI).
The number of days with unhealthy air quality fluctuated from 2019 to 2024. Days decreased from 2020 to 2021, then increased from 2021 to 2022, followed by decreases from 2022 through 2024.
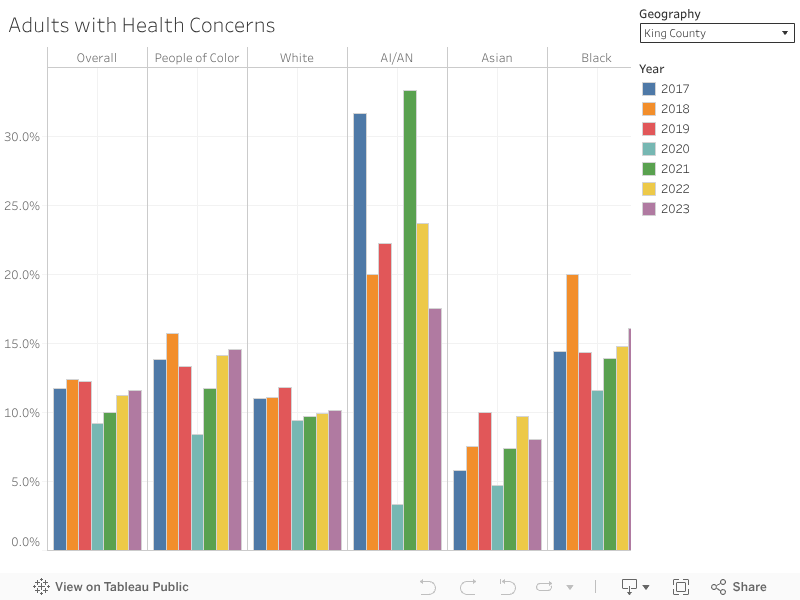
Adults with Health Concerns
Overall Health Reflects Personal Well-Being
Percentage of adults ages 18+ who reported that their general health is fair or poor.
Why is this metric important? Individual perspective on health status provides insight into the general feeling of well-being and security felt by the region's residents.
*Interpret AI/AN and NHPI percentages with caution since there are small sample sizes. These were included to ensure representation.
Source: Washington State Department of Health | Data Systems
Year: 2023
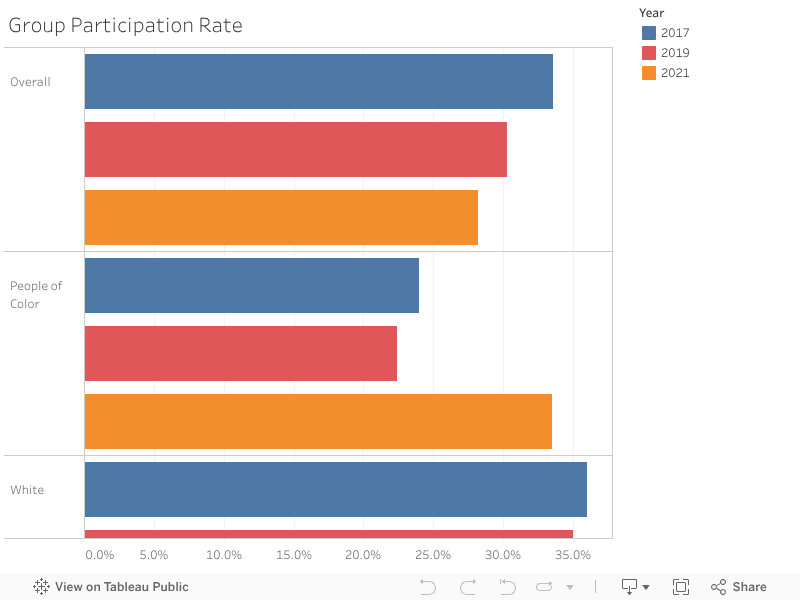
Group Participation Rate
Participating in Groups Strengthens Wellness
Percentage of the population surveyed by National Conference on Citizenship (NCoC) in Seattle-Tacoma-Bellevue Metropolitan Area that participated in at least one group.
Why is this metric important? Participation fosters feelings of belonging and connection, leading to better overall mental and physical health.
Source: National Conference on Citizenship | Civic Health Index
Year: 2021
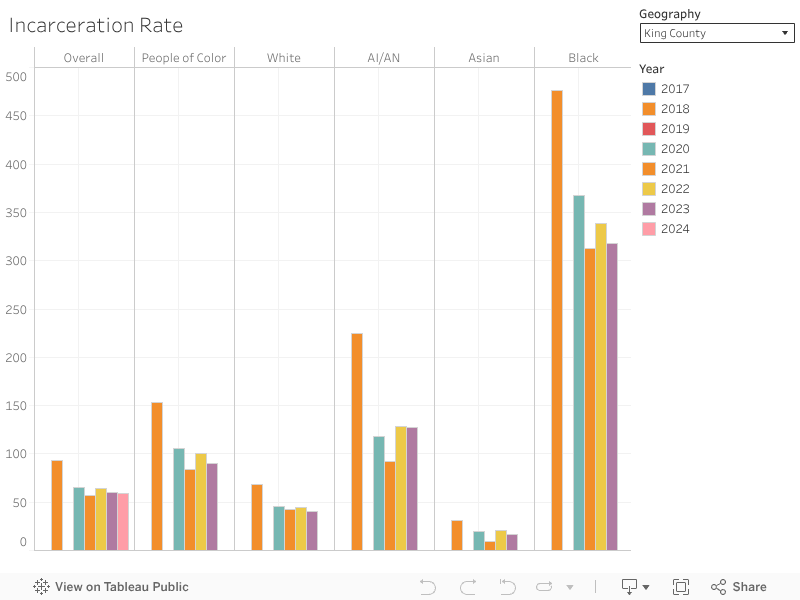
Incarceration Rate
Adults in Custody Highlight Health and Safety Challenges
Number of people incarcerated (adult detention population) per 100,000 residents, by county jail.
Why is this metric important? High rates of incarceration have negative effects on family stability, toxic stress levels, and have been shown to be connected with poor health outcomes for individuals.
*Agencies did not provide or confirm values for King County in 2017, 2019, and 2024, or for Snohomish County in 2022 and 2024. As a result, regional data may not accurately reflect the true trend.
Source: Washington Association of Sheriffs & Police Chiefs | Criminal Justice Information Services, Washington OFM | Washington OFM Data
Year: 2024
Individuals with Health Insurance
Health Coverage Supports Individual Well-Being
Out of the total population, the percentage who do have health insurance coverage.
Why is this metric important? Measuring the insured population shows the extent of access to medical care, as having coverage increases the likelihood of receiving timely treatment and preventive services, providing insight into individuals’ well-being.
Source: U.S. Census Bureau | American Community Survey 5-Year Estimates
Year: 2023
Poor Mental Health
Mental Health Influences Overall Wellness
Percentage of population that reported 14+ days when their mental health is not good.
Why is this metric important? Mental health is a significant contributor to overall health, and can result in isolation and loss of a sense of belonging. It is also often a precursor to people experiencing homelessness.
*Interpret AI/AN and NHPI percentages with caution since there are small sample sizes. These were included to ensure representation.
Source: Washington State Department of Health | Data Systems
Year: 2023
Poor Physical Health
Physical Strain Limits Residents’ Daily Lives
Percentage of population that reported 14+ days when their physical health is not good.
Why is this metric important? Poor physical health, including chronic illnesses, creates barriers for individual participation in the economy, and drives costs through the health care system.
*Interpret AI/AN and NHPI percentages with caution since there are small sample sizes. These were included to ensure representation.
Source: Washington State Department of Health | Data Systems
Year: 2023
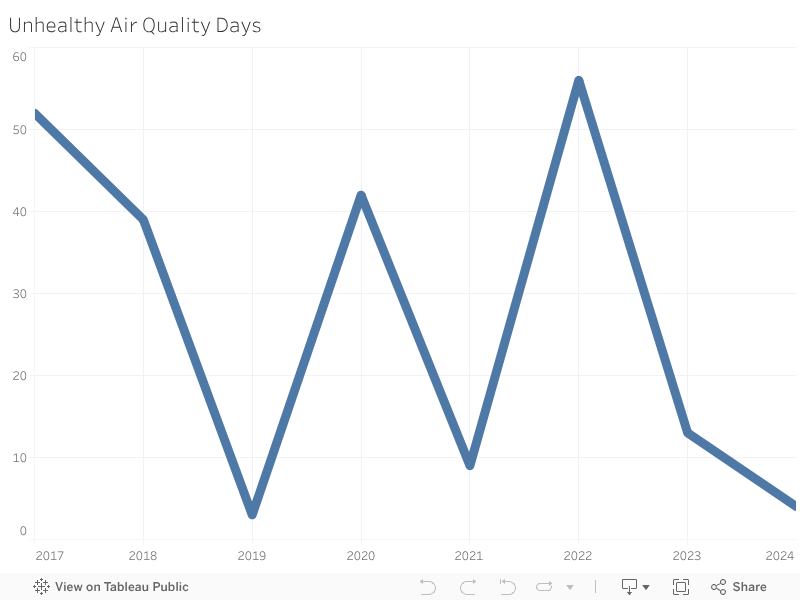
Unhealthy Air Quality Days
Unhealthy Air Shapes Daily Life and Health
Number of days with air quality rated unhealthy for sensitive groups, unhealthy, or very unhealthy.
Why is this metric important? Unhealthy air quality restricts activity for all residents, and acutely impacts sensitive and unhealthy group's quality of life.
Source: Environmental Protection Agency | Outdoor Air Quality Data
Year: 2024
Explore all five dimensions of shared prosperity:


Households
Individuals
Economy
Communities
