00 Households
Households thrive when families can build wealth over time through long-term assets like personal savings and property ownership, as well as entrepreneurship.
-0.8% change in cost-burdened households
(as of 2023)
-0.8% change in cost-burdened households (as of 2023)

What are we seeing?
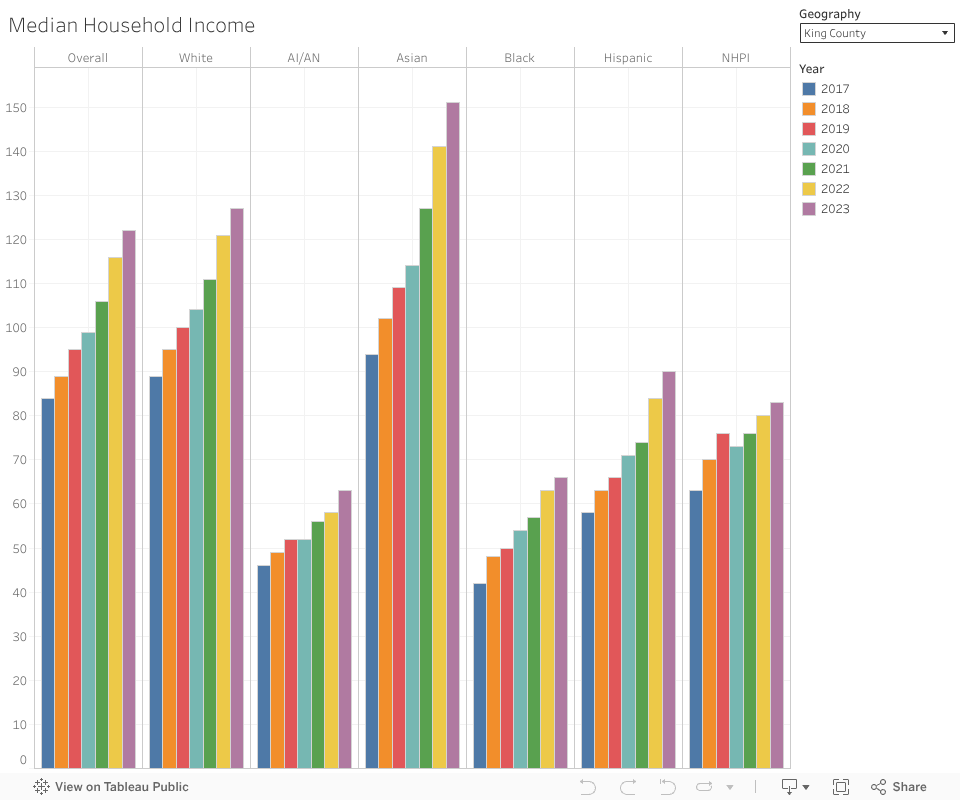
Median household income has increased in 2023 for all four counties as well as across all racial and ethnic groups. The median white household income remains larger than households of Black, American Indian or Alaskan Native (AI/AN), Native Hawaiian or Pacific Islander (NHPI), and Hispanic people.
High school graduation rates decreased for almost all groups in 2024, declining on average between 2-3% for all race groups, besides Asian students whose rates stayed the same. On-time graduation rates for American Indian or Alaskan Native (AI/AN), Native Hawaiian or Pacific Islander (NHPI), and Hispanic students averaged 75%.
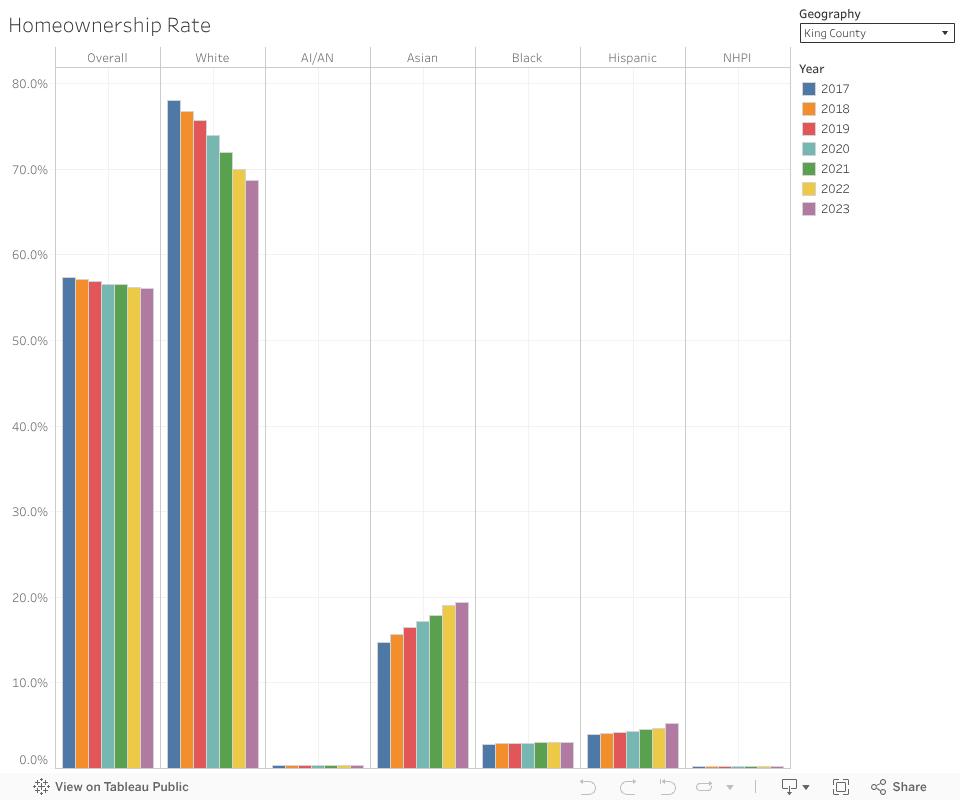
Homeownership has stayed consistent across all racial categories between 2022 and 2023.
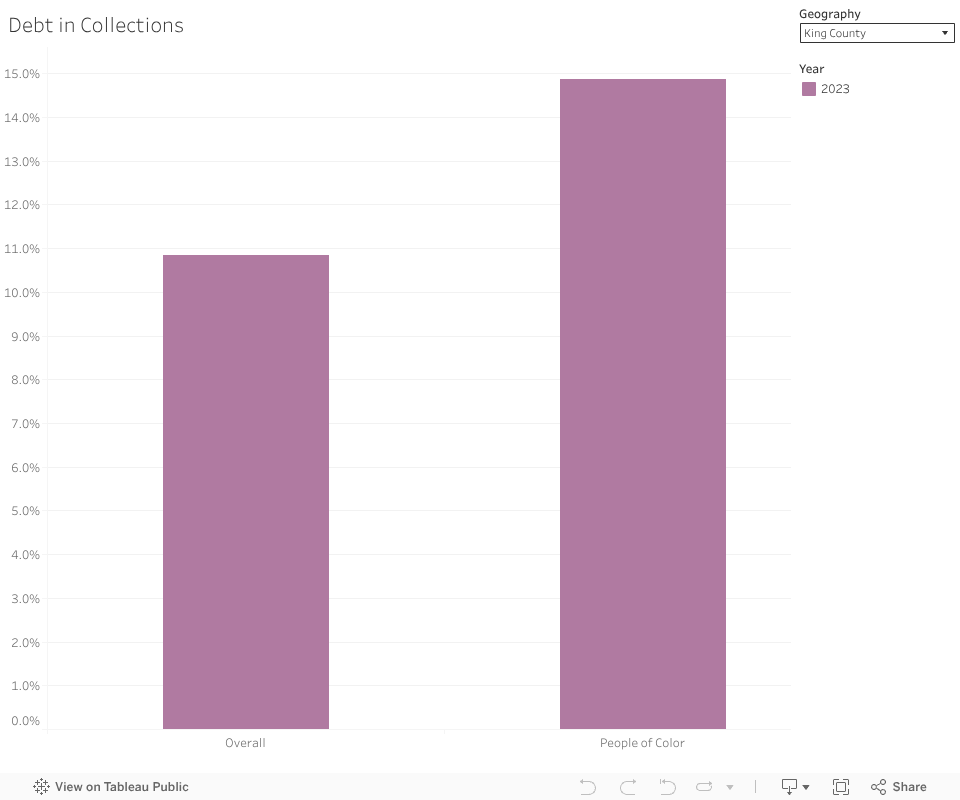
In 2023, people of color in Washington State had about 1.07 times the debt in collections compared to white people. This pattern was consistent across the three counties, except Kitsap County where POC debt data was unavailable, with POC generally showing higher collection rates than white people.
median household income
Median Income Reflects Families’ Economic Stability
Annual median household income (in 1000's of Dollars).
Why is this metric important? Growth in household income is a critical driver in building household wealth and also leads to increased consumption which supports broader economic growth for the region.
Source: U.S. Census Bureau | American Community Survey 5-Year Estimates
Year: 2023
Homeownership Rate
Homeownership Supports Families’ Financial Security
Percentage of population that owns a home.
Why is this metric important? Homeownership is a primary method of building household wealth over time and provides greater financial security and flexibility.
*Interpret AI/AN and NHPI percentages with caution since there are small sample sizes. These were included to ensure representation.
Source: U.S. Census Bureau | American Community Survey 5-Year Estimates
Year: 2023
Debt in Collections
Debt in Collections Strains Household Finances
The percentage of individuals with a credit bureau record who have debt in collections.
Why is this metric important? Debt from credit or unpaid bills can strain the financial well-being of families and communities.
*Because regional data could not be appropriately aggregated, the overall figure represents Washington State.
**In the most recent update, the Urban Institute revised the threshold used to define white communities and communities of color, rendering the data not directly comparable with previous releases. Consequently, the graph commences with data from 2023.
Source: Urban Institute | Debt in America: An Interactive Map
Year: 2023
Cost-Burdened Households
High Housing Costs Limit Household Opportunity
Combined percentage of renter and owner units with housing costs more than 30% of household income.
Why is this metric important? Housing costs in excess of 30% of income limit financial security, and can prevent upward mobility by restricting funds available for personal growth and continued education.
Source: U.S. Census Bureau | American Community Survey 5-Year Estimates
Year: 2023

On-Time High School Graduation
Graduating On Time Strengthens Future Opportunities
Percentage of students in the region who graduate high school in 4 years.
Why is this metric important? A highly functioning education system results in a resident base that is engaged, employable, and productive.
Source: State of Washington | Access Washington
Year: 2024

Explore all five dimensions of shared prosperity:


