Communities
Communities thrive when residents are stable, food secure and not forced to move due to cost of living, development, or access issues. Environmental sustainability also plays a critical role in community health.

What are we seeing?
The food insecurity rate increased from 10.5% to 11.80% from 2022 to 2023.
Median rental prices continued to rise for all four counties.
CO2 emissions saw a significant 19% decrease from 2019 to 2020, primarily due to reduced travel during COVID, but rose again from 2020 to 2023.
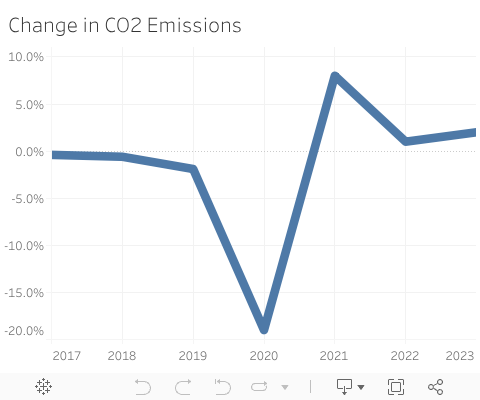
Change in CO2 Emissions
Headline Placholder
<Year-over-year percentage change in carbon dioxide emissions in million metric tons in Washington State.>
Why is this metric important? Carbon emissions are directly tied to changing climate and the downstream impacts on health, livability, and economic distress caused that most acutely impact vulnerable communities.
Source: U.S. Energy Information Administration | Energy-Related CO2 Emission Data Tables
Year: 2023
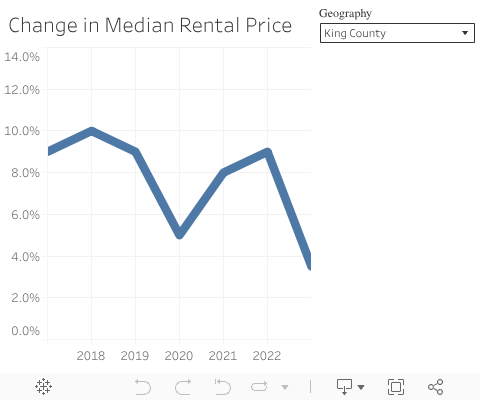
Change in Median Rental Price
Headline Placeholder
<Percent annual change in median rental price for 1-bedroom apartment.>
Why is this metric important? Indicates the general inflation rate for housing in the region, which has been shown to highly correlate to the incidence of people experiencing homelessness. This measure is influenced by both the supply of affordable housing as well as overall demand.
Source: U.S. Census Bureau | American Community Survey 5-Year Estimates
Year: 2023
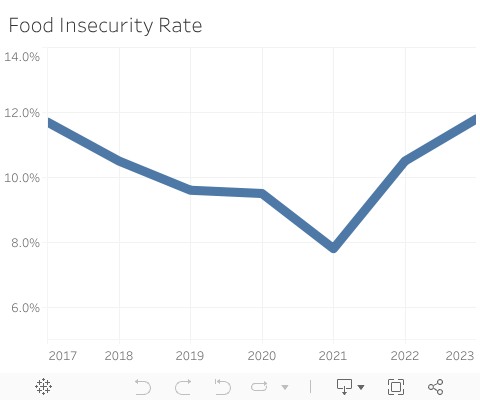
Food Insecurity Rate
Headline Placeholder
<Percentage of population that is food insecure in the region. Food insecurity refers to USDA’s measure of lack of access, at times, to have enough food for an active, healthy life for all household members and limited or uncertain availability of nutritionally adequate foods.>
Why is this metric important? Experiencing hunger can be a barrier to educational success, participation in the economy, and can lead to poor health including malnutrition.
Source: Feeding America | Map the Meal Gap
Year: 2023
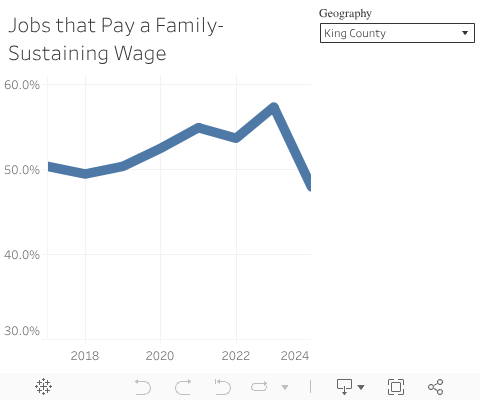
Jobs that Pay a Family-Sustaining Wage
Headline Placeholder
<Percent of total jobs that pay a family-sustaining wage (defined as two working adults with two children); i.e., share of total employment/jobs in the Seattle-Tacoma-Bellevue (King, Pierce, and Snohomish Counties) and Bremerton-Silverdale (Kitsap County) Metro area that has a mean hourly wage equal to or greater than the living wage from the MIT index.>
Why is this metric important? Family sustaining wages promote economic security and mobility for households, and prevent individuals from needing to have multiple jobs.
*Due to changes in their methodology, MIT no longer makes living wage data prior to 2024 publicly available. To account for the new methodology used by MIT, this chart backcast a new living wage for 2017-2022 by applying the Personal Consumption Expenditures Price Deflator from the Bureau of Economic Analysis to the 2023 MIT Living Wage. This deflator captures shifts in the cost of everyday goods and services over time that affect the required wage for supporting a family. The current calculation of percent of jobs earning a living wage for 2023 uses 2022 wage data by occupation.
Source: Massachusetts Institute of Technology | Living Wage Calculator, U.S. Bureau of Labor Statistics | Occupational Employment and Wage Statistics, Bureau of Economic Analysis | National Income and Product Accounts
Year: 2024
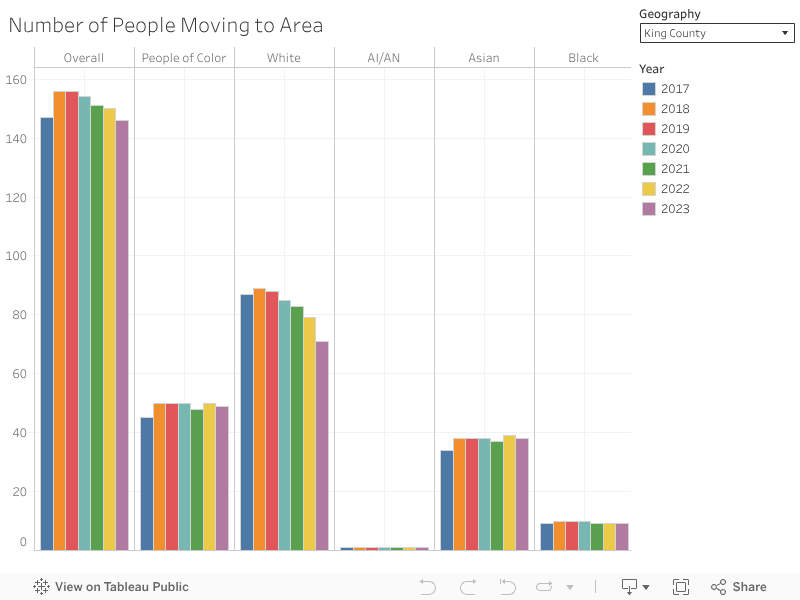
Number of People Moving to Area
Headline Placeholder
<Population who moved to the area from another county, state, or country (in 1000s).>
Why is this metric important? Migration into our region provides a deeper pool of talent for businesses to employ, and indicates a region that is attractive to outsiders.
*Interpret AI/AN and NHPI percentages with caution since there are small sample sizes. These were included to ensure representation.
Source: U.S. Census Bureau | American Community Survey 5-Year Estimates
Year: 2023
Population in High Capacity Transit Station Areas
Headline Placeholder
<Percentage of population that live close to high-capacity transit areas.>
Why is this metric important? Well designed transit networks, coupled with easy access connect residents with job centers, create economic opportunities for people while reducing traffic congestion.
Source: Puget Sound Regional Center | Puget Sound Regional Center Data Portal
Year: 2024


